
Data-Driven Reduction Strategies
Steer your global decarbonization efficiently
Global supply chains require a holistic approach to reach net-zero. shipzero provides the maximum data quality your controlling teams need to steer efficiently, identifying hot spots and modeling scenarios to bridge the gap between your current Scope 3 logistics emissions and your target state.

Used by leading companies


.svg)
Strategic Control
Key Benefits of Data-Driven Reduction Strategies
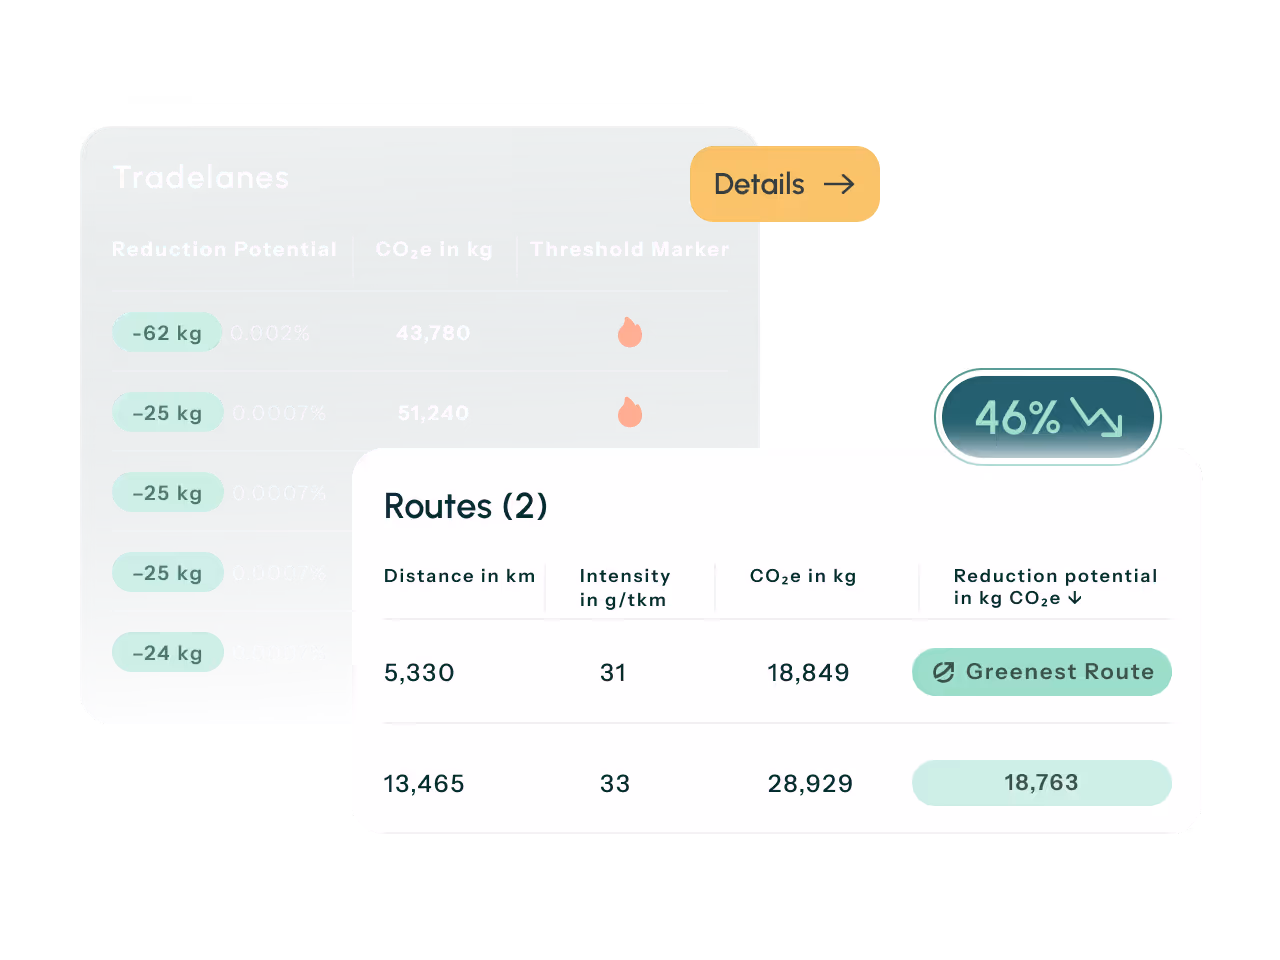
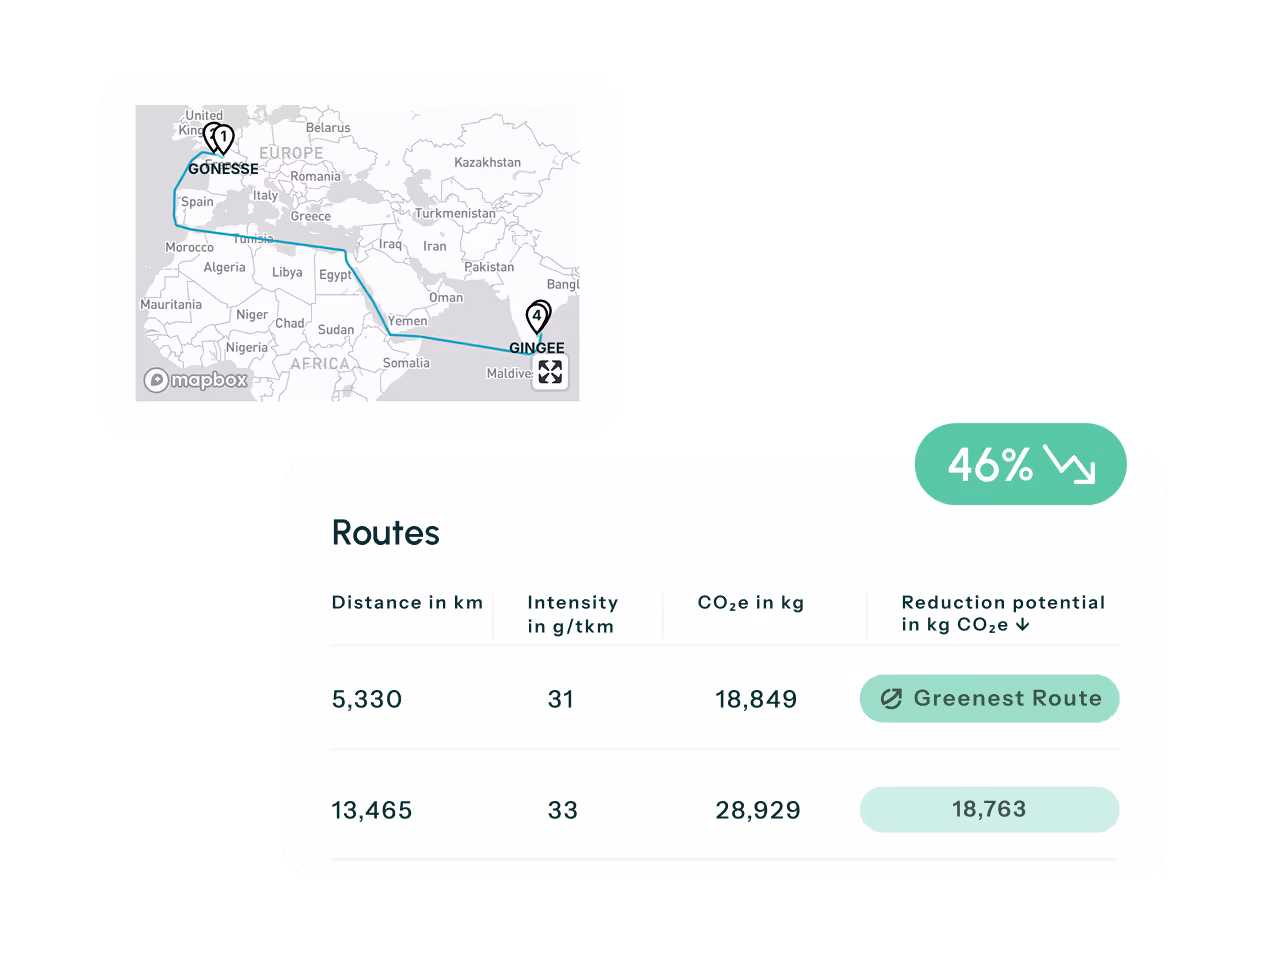
Analyze Global Hot Spots
Approach holistic analysis for global supply chains to identify emission hot spots and enable efficient steering by controlling teams and sustainability functions.
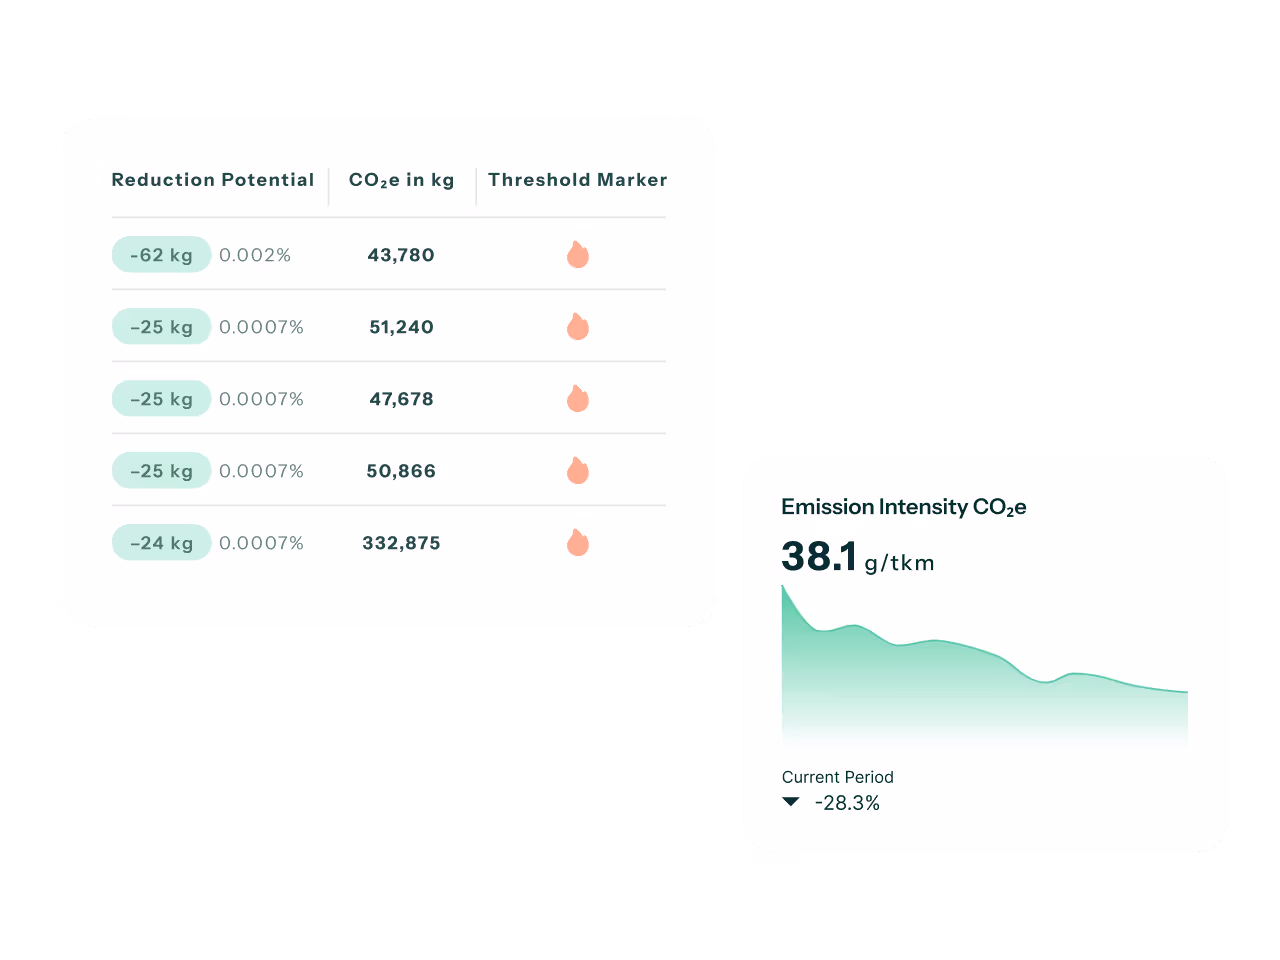
Determine Strategic Gaps
Define your Scope 3 decarbonization strategy and determine the precise gaps to your target state per business unit and geography based on standardized methodologies such as ISO 14083 and the GLEC Framework.
Model Future Scenarios
Model top-down and bottom-up scenarios to assess how measures meet reduction goals and confirm potential with business units.
Plan Targets by Lane
Break down top-down goals into trade lanes and follow up bottom-up to verify what is achievable in specific markets.
“Thanks to shipzero’s profound data granularity approach and focus on primary data integration, our data accuracy improves significantly – we are gaining a full overview of transport emissions within our supply chain.”


Turn Climate Ambition into Actionable Strategy
Efficient Steering
Identify Emission Hot Spots
Effective controlling requires high-quality data. We strive for a holistic analysis of your global supply chain, delivering the maximum data quality needed to identify emission hot spots. This allows your controlling department to steer efficiently, focusing resources on the areas with the highest CO₂e reduction potential.
- Goal: holistic global analysis
- Maximum data quality
- Efficient hot spot steering
Strategic Clarity
Determine Gaps to Target
Know exactly where you stand. We help you define your Scope 3 decarbonization strategy and determine the precise gaps to your target state. This analysis is granular, broken down per business unit and per geography, ensuring that every part of your organization understands its specific contribution to Scope 3 reduction goals.
- Scope 3 strategy definition
- Gap analysis to target state
- Per business unit & geography
Scenario Analysis
Model Reduction Scenarios
Validate your path to net-zero. Model top-down and bottom-up decarbonization scenarios to assess how specific measures meet your reduction goals. This allows you to confirm the potential of initiatives with relevant business units and procurement teams before implementation and before making long‑term contractual commitments.
- Top-down & bottom-up models
- Assess measure effectiveness
- Confirm potential with stakeholders
Granular Planning
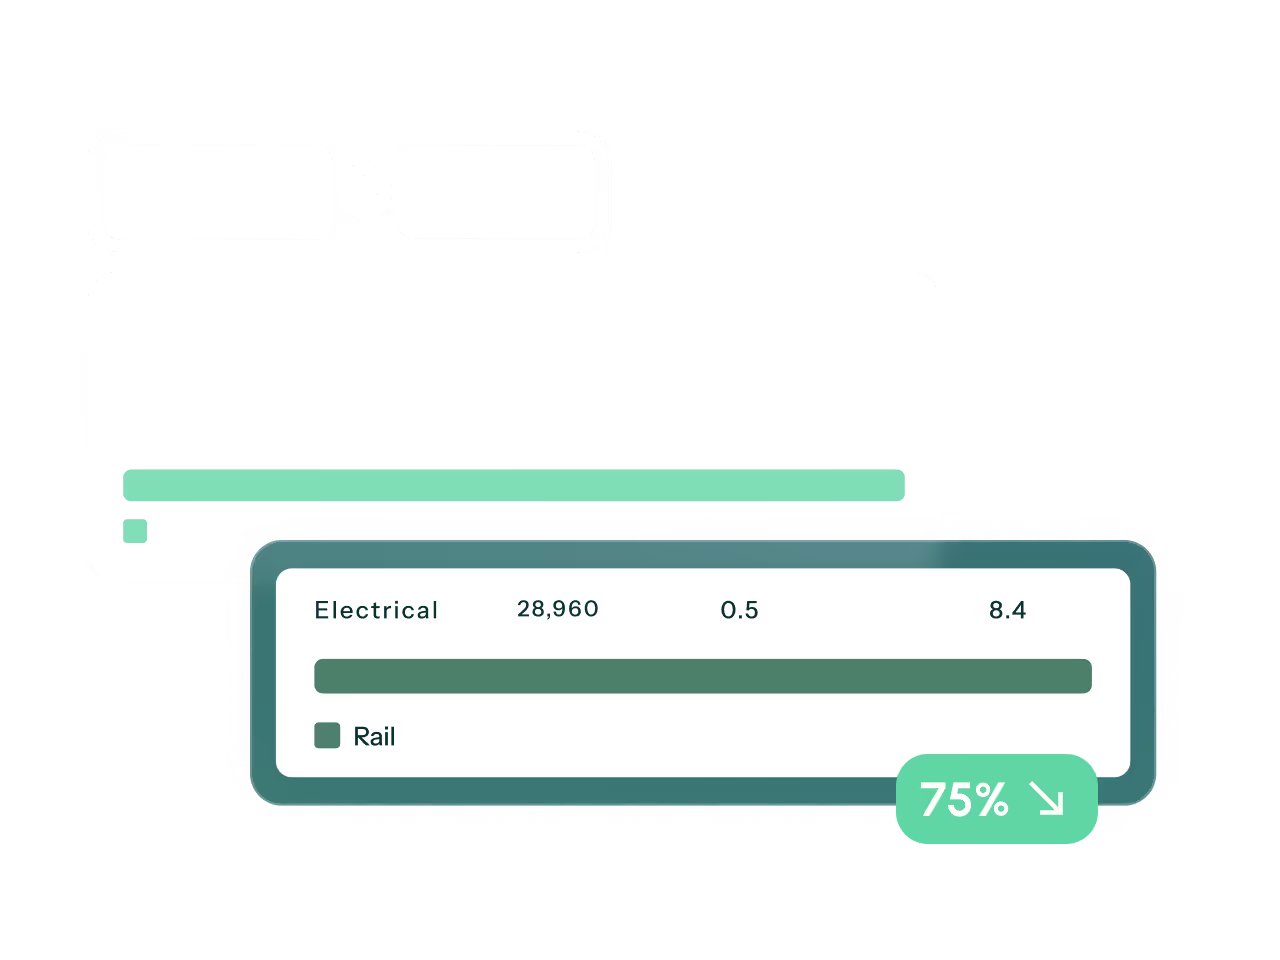
Plan Targets by Trade Lane
Translate goals into reality. Break down your top-down decarbonization goals into specific trade lanes. Then, follow up bottom-up to verify what can actually be achieved in specific markets, considering specific transport modes and propulsion types and local infrastructure constraints.
- Break down goals to trade lanes
- Bottom-up market verification
- Mode & propulsion specifics

More Uses Cases
What else you can do with us
From Book & Claim to Carbon Accounting and Partner & Supplier Integration, see how we can help with your emissions reduction journey.


Book & Claim
Decouple emission reductions from physical routes to monetize green investments.
Green Procurement
Drive sustainable procurement with data-based decisions and independent validation.

Data Ingestion
Unify scattered logistics data and increase data quality.

Carbon Accounting
Audit-proof emissions calculation for complex supply chains.
FAQs
Do you have questions about implementing Data-driven Reduction Strategies as a cargo owner? We've compiled answers to common inquiries based on our experience helping global organizations steer their Scope 3 logistics decarbonization efforts.
To steer efficiently, controlling needs the full picture. A holistic analysis ensures maximum data quality across the global supply chain, allowing you to identify "hot spots" – areas with the highest emissions. So, you can prioritize actions effectively and allocate resources where they matter most for CO₂e reduction.
Very granular. We help you determine the gaps to your target state not just globally, but per business unit and per geography. This ensures that every part of your organization understands its specific contribution to the Scope 3 reduction goals and can be held accountable with clear, quantifiable targets.
Top-down sets the ambition, but bottom-up confirms reality. By modeling both, you can assess if your high-level reduction goals are actually achievable given the specific constraints and opportunities in your markets, confirming potential with procurement and business units before committing to investments or supplier changes.
Yes. Our platform allows you to break down targets per transport mode and propulsion type. This level of detail is essential for understanding the impact of specific levers, such as shifting from road to rail or adopting HVO fuels on specific lanes, and for aligning these choices with your Book & Claim and procurement strategies.
Decarbonization potential varies by region. By following up bottom-up on specific trade lanes, you can verify what is actually achievable in those markets – considering local infrastructure and fuel availability – rather than relying on a uniform global assumption that might miss the mark for specific regions or trade lanes.